On any given day, we handle around 15% of daily retail trading volume across all stock exchanges in India. Billions of requests generated in the process are handled by a suite of systems we have built in-house. Also, we are very particular on self-hosting as many dependencies as possible, everything from CRMs to large databases, Kafka clusters, mail servers etc.
To aid these primary systems, there are a large number of ancillary workloads that run, covering everything from real-time trades, document processing, KYC, and account opening, legal and compliance, complex, large scale P&L and number crunching, and a wide range of backoffice workloads. The systems are spread across a hybrid setup; physical racks across two different data centres (where exchange leased lines terminate) and AWS. All of this means that we have a lot of dynamic workloads and dissimilar systems and environments, bare metal to Kubernetes clusters, to be monitored independently.
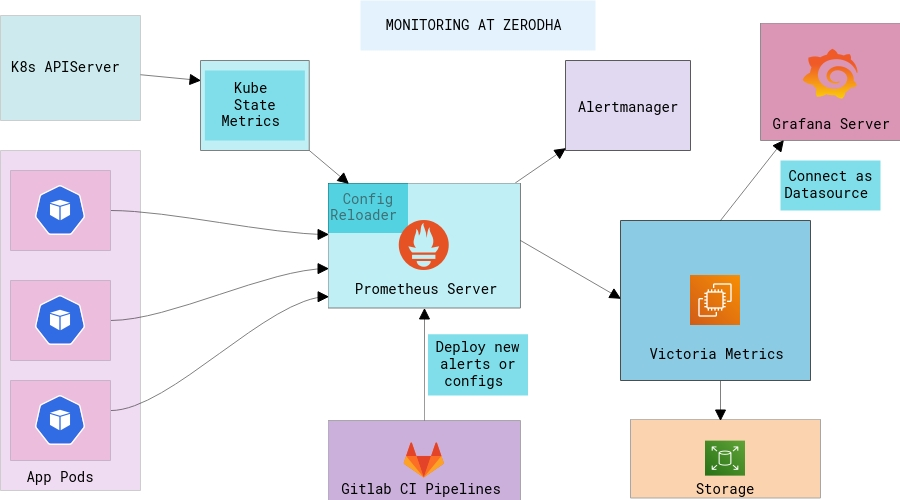
Prometheus
We picked Prometheus for time series metrics, and for its powerful query language (we did evaluate multiple options like Sensu, Nagios, ELK etc. just to be sure). Prometheus was developed at SoundCloud initially and it borrowed a few ideas from Borgmon. Since then, it has become an active, standalone FOSS project, with active community participation. It is also a part of CNCF.
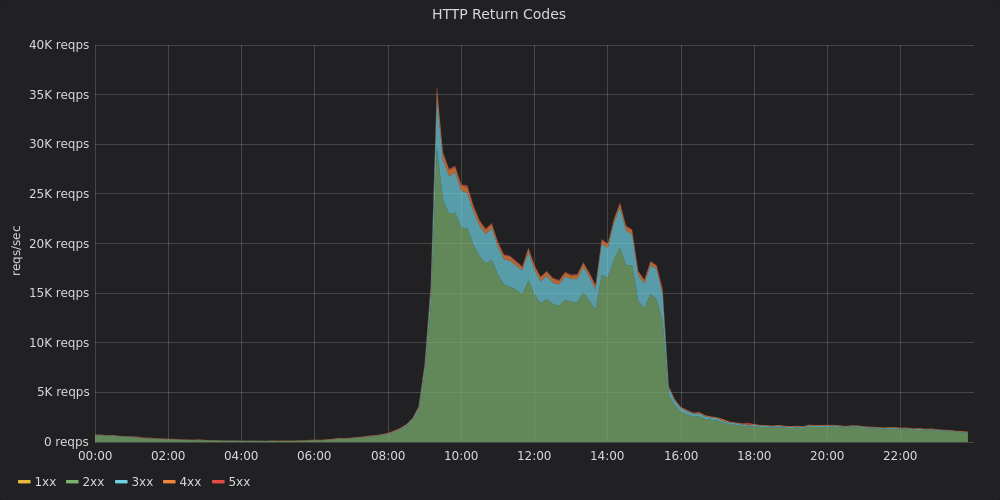
Prometheus offers a multidimensional approach to identifying metrics with key-value pairs called labels. With PromQL, we can use labels to filter and aggregate these dimensions. Just to give an example, to see the number of requests grouped by HTTP status codes, we can write a query like this:
sum by (status) (rate(http_requests_total[5m]))
Service discovery
Prometheus operates in a top-down “pull” approach, which means that Prometheus needs to “discover” and pull the metrics from the target instances. The targets can be EC2 instances, Kubernetes pods, or a simple JSON file listing host IPs. Maintaining a list of IPs in a multi-DC, bare-metal + cloud environment isn’t feasible.
Thankfully, Prometheus has a Service Discovery module that plugs in a lot of cloud provider backends and uses this to discover instances. At Zerodha, we use AWS for all our cloud infrastructure needs, so the ec2_sd_config module works well. We custom bake our AMIs using Packer and install a pre-configured set of exporters. Exporters are light weight daemons that expose metrics data on an HTTP interface for Prometheus. Service discovery module is super handy—simply adding the monitoring:enabled EC2 tag makes instances discoverable. Here’s the relevant Prometheus job configuration snippet which we use to discover instances:
- job_name: "zerodha-ec2"
  ec2_sd_configs:
    - region: ap-south-1
      port: 9100
      # Only monitor instances with tag monitoring
      - source_labels: [__meta_ec2_tag_monitoring]
        regex: "enabled"
        action: keep
Our bare metal racks across DCs also have various exporters running. These racks are connected to our AWS VPCs via P2P leased lines. Since these instances have well defined static IPs, unlike a cloud environment, we can use the static_config module to scrape metrics. Here’s a short snippet demonstrating that:
  - job_name: "dc1-server-node"
    scrape_interval: 1m
    metrics_path: "/dc1/node-exporter/metrics"
    scheme: "http"
    static_configs:
      - targets: ["dc1.internal"]
          labels:
              service: dc1-server
    relabel_configs:
      - source_labels: [__address__]
          action: replace
          replacement: "dc1-server"
          target_label: hostname
Prometheus in Kubernetes
More recently, we’ve started moving different kinds of workloads to Kubernetes primarily for uniform deployments. Utilizing the same monitoring components inside Kubernetes is not so straight-forward if there are multiple clusters and if you want high availability across Prometheus. These are the pain points that had to be dealt with first:
Large amounts of time-series data generated by Kubernetes objects
We run kube-state-metrics which stores the metadata of each resource type in Kubernetes. In Kubernetes, you can deploy a metrics-server which is used by the HPA controller to scale up/down the pods based on memory/CPU rules. But since the nature of pods is very dynamic, it is necessary to monitor data way beyond just CPU and Memory. At present, kube-state-metrics has support for about 30 resources and together they generate a lot of data. So, the first objective was to find a solution which could handle hundreds of millions of active data points at any given time across all clusters.
Handling storage in each cluster
While Prometheus instances are deployed independently in each cluster, manually managing the long term storage for each instance is not feasible. Quoting from the official documentation:
“Note that a limitation of the local storage is that it is not clustered or replicated. Thus, it is not arbitrarily scalable or durable in the face of disk or node outages and should be treated as you would any other kind of single node database”
This meant the storage is limited by that particular node’s availability and scalability. Thankfully, Prometheus has support for remote storage integrations, and we looked at the options for creating a long term storage cluster for Prometheus. The basic idea was that all Prometheus nodes would push the metrics data in one storage cluster where we could define retention policies, backups and take snapshots all in one place. This is much easier to manage than independent EBS volumes scattered across our infra.
We set out to explore Thanos which is a pretty popular choice amongst people looking to set up HA on Prometheus. But Thanos turned out to have a lot of components and the kind of operational complexity required to just get it up and running seemed unnecessary.
Victoria Metrics was another project that was quite new and in its early days which aimed to offer similar features to Thanos. It ships as a single binary! While Victoria Metrics was bleeding edge, we were already familiar with valyala’s (principal contributor to Victoria Metrics) Go projects, which instilled the extra confidence to make the tradeoff. The benchmarks are quite something and seem to show that the ingesting performance is better while also using lesser RAM and disk space than the counterparts.
Prometheus writes incoming metrics data to local disk storage and replicates it to remote storage in parallel. It maintains a WAL (Write Ahead Log), which means even if the remote storage endpoint is unavailable, the metrics data is preserved in local storage for --storage.tsdb.retention.time duration.
We have about 56 billion time series data points in our Victoria Metrics cluster at this point after the regular periodic cleanups which happen based on retention policies.

On average, we ingest tens of thousands of time series metrics (from multiple K8s clusters and EC2 nodes) every second.
VictoriaMetrics natively supports Prometheus Query API which means that it can be used as a drop-in replacement for the Prometheus data source in Grafana as well. We can use the same PromQL queries and aggregate the metrics across clusters, which is quite amazing. It is highly optimized for time series metrics with high churn rates, and is also optimized for storage operations.
From our experience, a single node Victoria Metrics instance is capable of handling humongous amounts of time series data without breaking sweat.
Operating and managing configuration across clusters
We use Prometheus Operator to deploy the complete Prometheus stack along with auxiliary services like Node Exporter and Kube State Metrics. Kubernetes Operators are a way of managing the entire lifecycle of an application using Kubernetes SDKs. The creation/deletion/scaling and reloading of configuration as well are all handled by the operator. For example, we can configure Prometheus with a spec native to Kubernetes:
apiVersion: monitoring.coreos.com/v1
kind: Prometheus
metadata:
  labels:
    prometheus: k8s
  name: k8s
  namespace: monitoring
spec:
  replicas: 3
  externalLabels:
    cluster: zerodha-k8s
  remoteWrite:
    - url: http://<victoriametrics-addr>:8428/api/v1/write
We use Kustomize heavily to organise our K8s manifest files and have developed a small utility, kubekutr around it. For all Prometheus Operator configs as well, we have taken the Kustomize approach of base and overlays.
The idea is that all the monitoring configuration which is common to each cluster is referenced as a “base” and configurations unique to each cluster are referenced as “overlays”. In any kind of a federated setup, where the actual metric ingestion is handled externally, there needs to be a unique identifier to each metric coming from different cluster sources. In the absence of a unique identifier, there are chances of indistinguishable metrics being emitted from 2 different clusters leading to incorrect data ingestion.
We can configure each Prometheus instance to always send a unique label with each metric produced. Here’s an example:
apiVersion: monitoring.coreos.com/v1
kind: Prometheus
metadata:
  labels:
    prometheus: k8s
  name: k8s
  namespace: monitoring
spec:
  replicas: 1
  externalLabels:
    zero_cluster: eks-cluster-dev
  remoteWrite:
    - url: http://monitoring.internal:8428/api/v1/write
  additionalAlertManagerConfigs:
    name: external-alertmanager
    key: external-alertmanager.yml
In the .spec.externalLabels field, we configure the Prometheus instance to send a zero_cluster: eks-cluster-dev with each metric name. On querying any metric data we can see the label being correctly appended:
{prometheus_replica="prometheus-k8s-0",zero_cluster="eks-cluster-dev"}
In the above example, some of the additional overrides we do in each cluster to the base configuration are visible. For example:
Replica Count: To customise the count of Prometheus instances to run based on the workload for that cluster.
Prometheus Remote: Remote storage API endpoint (Victoria Metrics in our case).
External alertmanager endpoints: Since Alertmanager runs outside the cluster, we specify the alertmanager configuration here.
Alertmanager
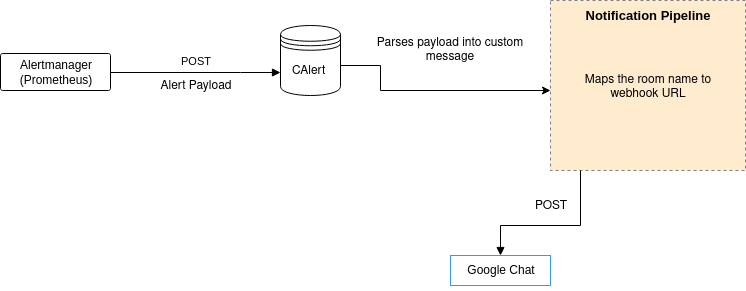
We run a central Alertmanager cluster. All of the Prometheus instances connect to this cluster directly. Alertmanager can de-duplicate the alerts so that the notification systems don’t get too noisy with the same type of alerts. Alerts can be pushed out to any target, like e-mail and IM clients. For instance, using Alertmanager webhook receivers, alerts are pushed to Google chat using a simple utility we wrote.
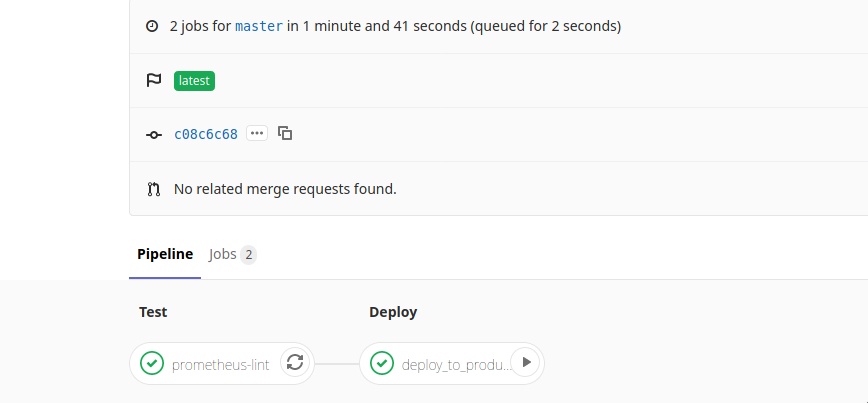
All our alert rules and configurations are version controlled in a GitLab repo. GitLab CI pipelines lint and validate the configurations and then upload them to an S3 bucket. There’s a sync server on the Alertmanager cluster to check for new config and automatically reload Alertmanager in case of any config updates.
Custom exporters
We have custom exporters that expose semantic information from our services.
We wrote a generic store-exporter that can fetch data from arbitrary SQL datastores like PostgreSQL/MySQL and expose them in the Prometheus metrics format. We also use this to extract business metrics and visualize them on Grafana. This also lets us set alerts for “anomalies” that deviate away from expected business behaviour.
We also have an embeddable HTTP exporter based on fasthttp that we use to expose RED metrics for various internal HTTP services. The VictoriaMetrics/metrics library is a nice lightweight alternative to the official library with far fewer dependencies.
Sidenote: We are extra careful on keeping package dependencies at a minimum across our critical applications. This is something that is revisited at reasonably regular intervals.
Apart from app metrics, we also use exporters to collect metadata from various AWS APIs. For instance:
- AWS P2P Direct Connection bandwidth and health.
- Alerts to keep a check on EBS snapshot policies and backups.
Grafana
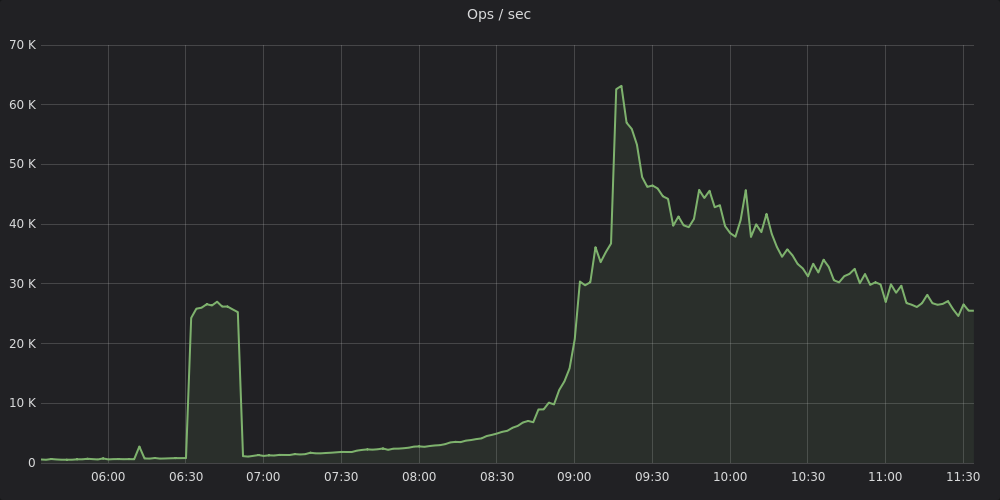
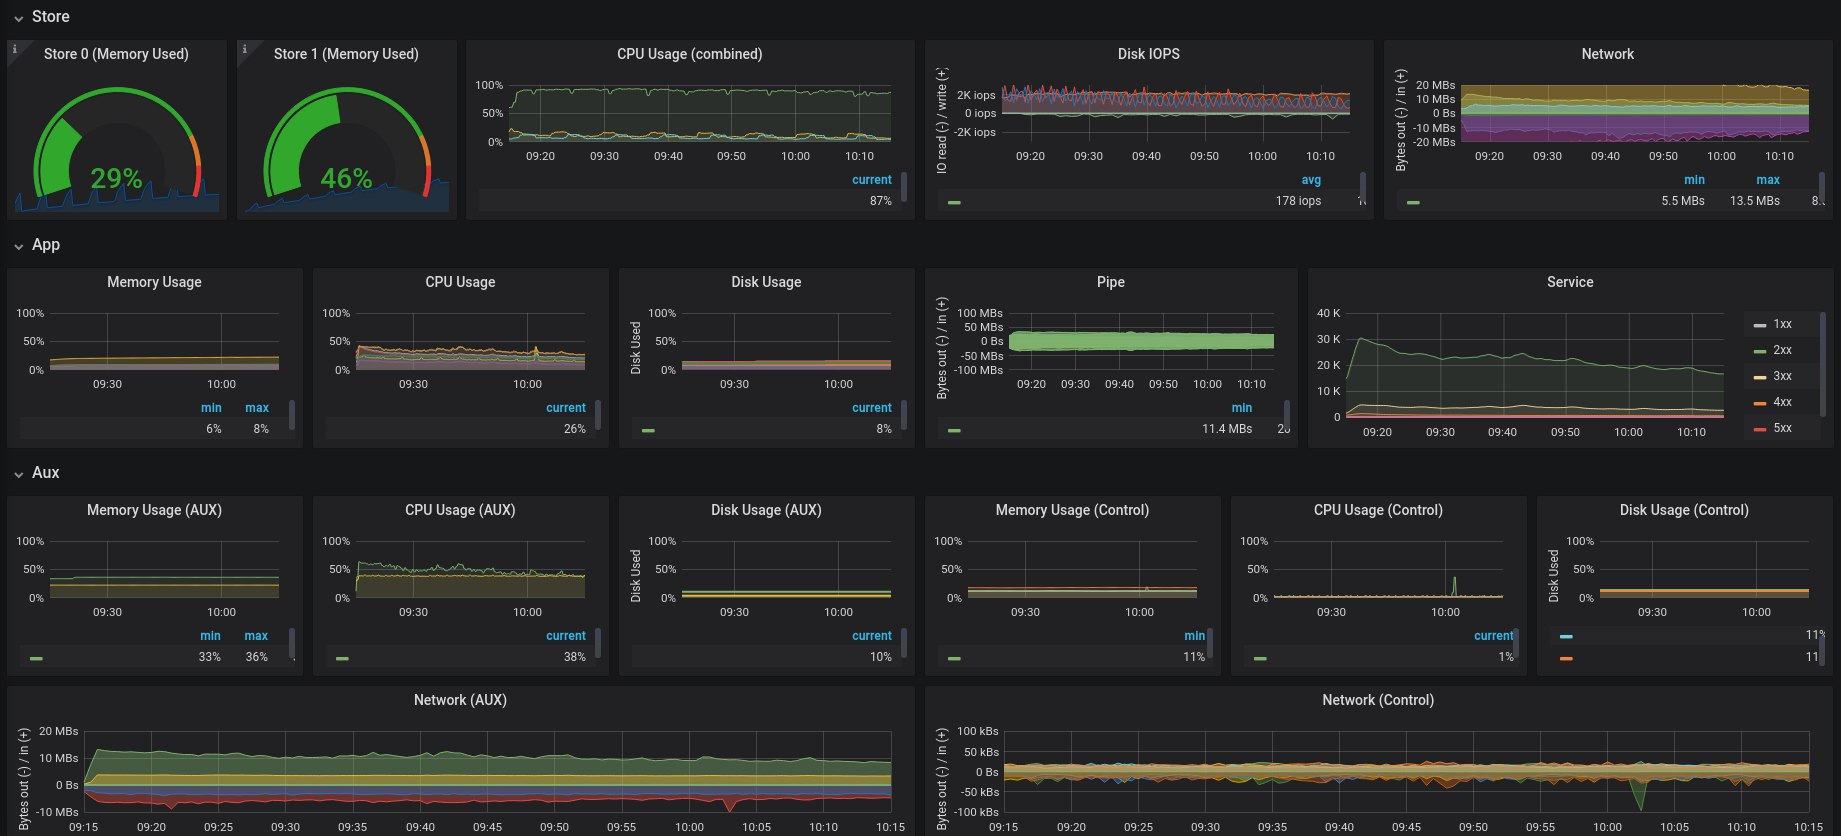
We run a pretty standard Grafana 6.x instance that is connected to our main datasource which is Victoria Metrics. There are dozens of custom dashboards along with stock dashboards for monitoring Postgres, HAProxy, NGINX, MySQL etc.

Summary
This was our experience building a monitoring stack for a hybrid environment involving physical multi-DC + AWS infra at Zerodha. We’ve used Victoria Metrics for our long term Prometheus storage needs and it contains tens of billions of events at any given point. We’ve setup high availability Prometheus clusters across bare metal and Kubernetes clusters. We’ve also developed a wide range of metrics exporters collecting all sorts of information from our systems including HTTP, app and infra specific metrics, AWS metadata, and business metrics. We generate alerts with our Alertmanager cluster which is plugged into our IM tools.
Our logging setup (ELK) with several terabytes of various kinds of logs, some that have to be persisted for years to comply with regulations, is the topic for a later post. Stay tuned.
Cheers!
