

At Zerodha, we run a multitude of internal and public-facing services that generate copious amounts of logs. While developers use these logs to debug or troubleshoot incidents, some services also emit logs that must be persisted for prolonged periods to comply with numerous regulatory requirements. In this post, I will delve into our experiences with the ELK stack, why it didn’t fit our needs and our migration to ClickHouse.
Why ELK wasn’t the right fit for us
In 2018, we adopted the ELK stack as our de facto stack for storing application logs. Using Filebeat, we shipped logs from EC2 instances to a central Logstash server. Logstash served as the aggregation layer, where we applied multiple filters to add metadata, scrub sensitive data, parse the logs, and dump them into various indices in Elasticsearch. Kibana was the default query layer for writing queries and fetching results. However, as our traffic volumes and user base increased significantly post-2020, our ELK stack began to struggle with the rising load.
In 2018, we handled less than 1/10th of our current traffic, so the single-node Elasticsearch worked well for us. Although it still required a decently large EC2 instance because of the huge JVM memory requirements, we hosted it without facing many challenges. However, post-2020, when our traffic volumes spiked and our user base increased much faster, the underlying logging system also started to choke.
A breakdown of our pain points with the ELK stack:
- Logstash pipeline would experience frequent slowdowns during peak traffic loads, resulting in slower ingestion times into Elasticsearch
- Storage costs skyrocketed as each incoming field is indexed for searching, inflating the storage requirements for each log event by a minimum of 3-4x the original size
- User experience for searching logs was subpar. The syntax for querying logs using Lucene or KQL was complex and not intuitive.
- Elasticsearch is slow for aggregate queries over a long period.
Choosing the right stack
As our traffic volumes continued to rise, it became apparent that we needed to migrate away from the ELK stack. We required a new stack that met the following criteria:
- Easy to operate: Log management is a complex issue, and the new stack should not exacerbate the problem.
- Cost-effective: Given that we are required to retain logs for multiple years, cheaper storage costs are desirable.
- Scalability: The new stack should be easily scalable to handle our increasing traffic volumes.
- Robust RBAC system: The new system must support creating ACL groups, allowing developers and business teams to query the underlying storage with varying levels of permission controls.
Log Events
To give you some context, we need to collect a variety of logs from our system, which runs on a mix of standalone EC2 instances and Nomad clusters.
Here’s a breakdown of the different types of logs and how we manage them:
App logs: For our application logs, we’ve developed a fixed schema that we use internally. Initially, we wrote a small wrapper around onelog to conform the output to our schema. However, we found that reading JSON logs while developing locally was tedious and not human-friendly. That’s when we discovered logfmt, which struck the right balance between human readability and machine parsability. To emit these logs and gradually migrate our applications to switch over to this library, we built and open-sourced an extremely performant and zero-allocation logging library in Go.
HTTP logs: We rely heavily on HAProxy and NGINX as the proxy layer between ALBs and our apps. To capture the required fields for our desired HTTP schema, we’ve written custom log templates for both proxies.
SMTP logs: For a long time we used self-hosted Postal SMTP servers for our emailing requirements. However, for our scale it was pretty slow and we started to look for faster alternatives. We found Haraka which gave us a 10x improvement in resource usage and throughput, because of its architecture and no external DB bottlenecks. However, Haraka doesn’t provide good logging out of the box. To address this, we built and open-sourced a Haraka plugin that emits JSON logs containing details such as the SMTP response, recipient, and subject.
The hunt for a good solution
Up until 2021, we dealt with the scaling of ELK issues by throwing more hardware at the problem. We also did extensive R&D with alternate options.
Here’s a rundown of what we found:
Grafana Loki - first impressions
Back in late 2019, we took a look at Grafana Loki 0.4. At the time, it was a relatively new project with limited storage options and a complicated microservice-oriented deployment setup. We ultimately decided against it due to the complexity of self-hosting it. But we kept an eye on it, hoping things would improve in the future.
Loki’s evolution and performance testing
Fast forward to 2021, and Loki had come a long way. Version 2.4 had simplified its deployment setup and addressed many past pain points. We were excited to see its new features, such as out-of-order writes in the index and BoltDB-based index storage for the filesystem. However, when we benchmarked its performance by importing a month’s worth of logs from our busiest application, Kite, the results were disappointing. Query times were painfully slow, and most queries timed out. Additionally, we found that Loki lacked good RBAC support in its open-source version.
Exploring cLoki and Clickhouse
In our search for a better solution, we discovered cLoki, a project that implemented Loki’s API with Clickhouse for storage. While it initially looked promising, we quickly realized that it didn’t use native Clickhouse compression codes and didn’t provide the flexibility to design a custom schema for our app logs. Query performance for non-trivial queries involving partial matching was also unimpressive. Moreover, we couldn’t add configurable partition options for different tables or parameters like TTLs or custom ordering keys/indices.
Welcome to Loj
Loj is the internal name we came up with while deciding on a name for our logging project. It was originally meant to be pronounced as log where g is pronounced as jee, but all of us pronounce it as loj. No one remembers why exactly it was named so, but clearly, we excel at naming things creatively.
While the DevOps team was exploring different stacks for storing logs, the back office (Console) team started to explore Clickhouse for a “warehouse” storage. This warehouse stores the holdings and breakdown of each trade done by every user on our platforms. We’d gained enough confidence to use it for logging also. In addition, we’d also been keeping an eye on it since Cloudflare posted about their adoption of Clickhouse for storing HTTP analytic logs. Since Clickhouse is an excellent choice for large OLAP workloads such as this warehouse and can handle large volumes of immutable data, we decided to try using it for storing our logs.
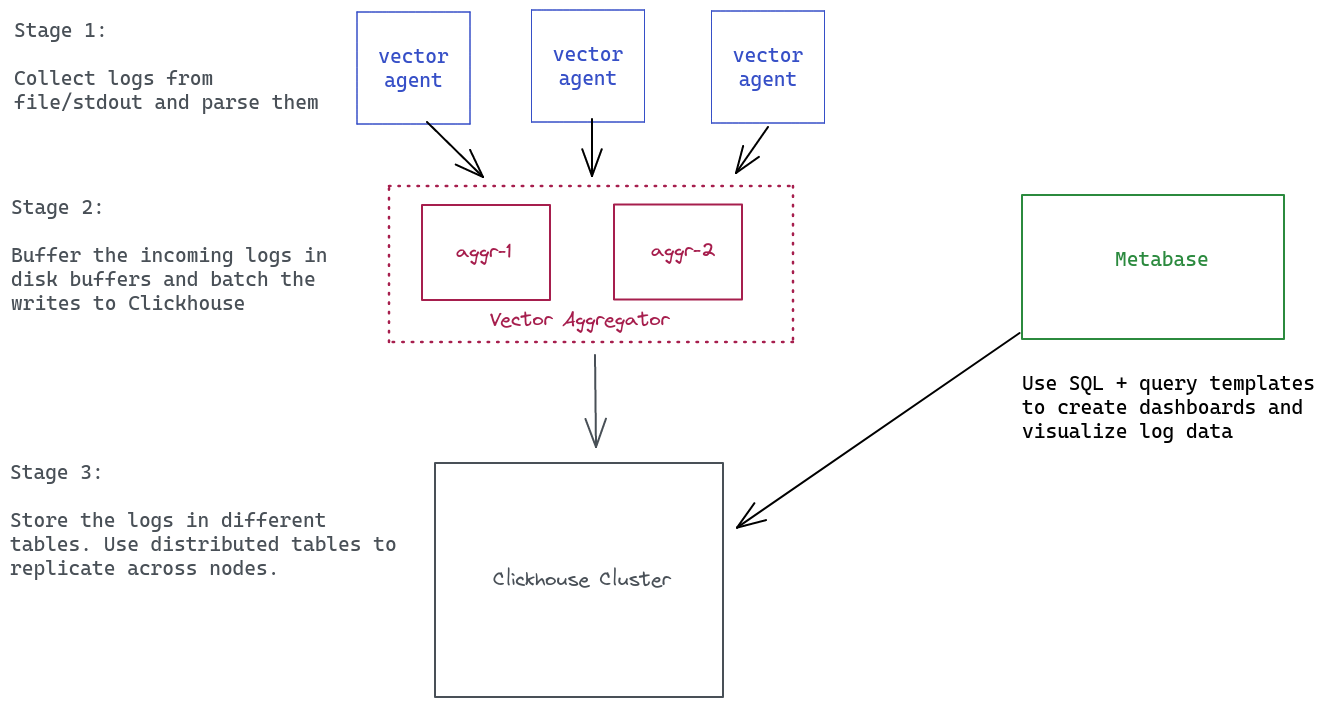
Loj is essentially a mix of 3 different components for our logging pipeline:
- Vector: For shipping logs to central storage.
- Clickhouse: Storage layer for all the logs.
- Metabase: Query/UI layer for visualizing/performing queries.
Clickhouse
Why Clickhouse is an excellent fit for logging:
Clickhouse, a column-oriented DBMS, is well suited for OLAP workloads. Logging workloads share similar attributes with OLAP workloads, such as being read-heavy, having large batches of inserts but rare mutations, and containing mostly immutable data.
Clickhouse’s compression codecs:
Clickhouse supports various compression codecs out of the box, including LZ4, Brotili, and ZSTD, at the block level. These codecs can reduce the amount of data that needs to be read from the disk, enhancing performance. Additionally, Clickhouse supports dictionary compression, which is useful for columns with low cardinalities.
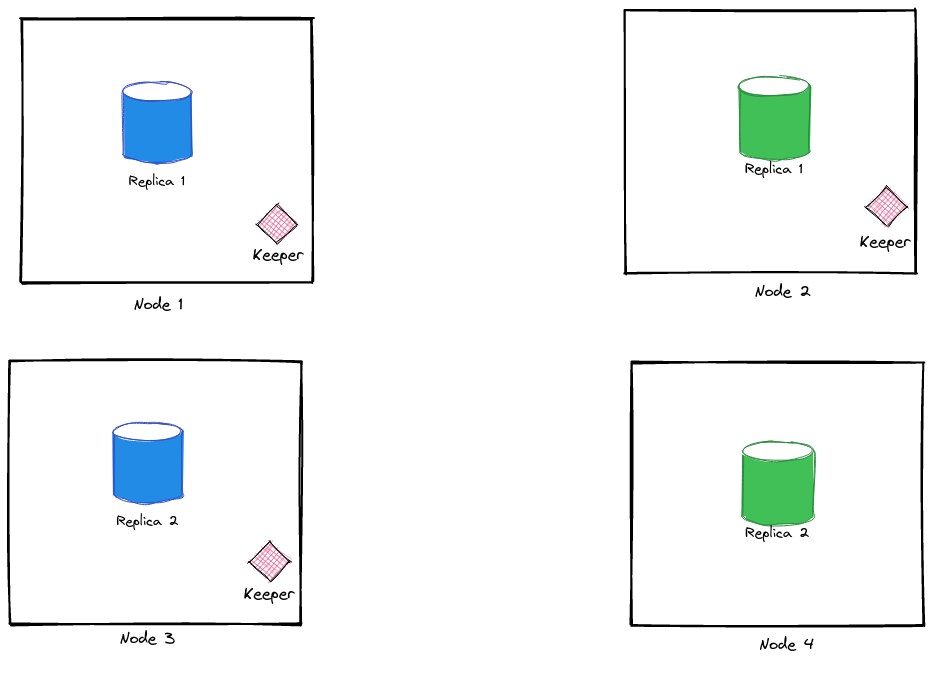
Scalability with Clickhouse:
Clickhouse is relatively easy to scale and comes bundled with clickhouse-keeper, which makes it possible to set up a distributed Clickhouse cluster with multiple nodes replicating data with each other. At Zerodha, we use a distributed Clickhouse cluster setup for storing all our logs. The cluster has two shards and two active replicas for each shard, totalling up to four nodes. If you want to learn how to configure clickhouse-keeper, you can refer to this post.
Schema for storing logs:
Designing a proper schema is a crucial step in ensuring optimal query performance in ClickHouse. While most of our apps follow a standard schema, we create tables with a specific schema for exceptional cases such as storing SMTP logs and AWS Pinpoint logs.
Here’s an example of our app schema:
CREATE TABLE IF NOT EXISTS app_local ON CLUSTER '{cluster}' (
	`_timestamp` Datetime64(3, 'Asia/Kolkata'),
	`_hostname` Nullable(String),
	`lvl` LowCardinality(String),
	`msg` Nullable(String),
	`sc` Nullable(String),
	`line` Nullable(String),
	`p` Nullable(String))
)
ENGINE = ReplicatedMergeTree('/clickhouse/tables/{cluster}/{shard}/{table}', '{replica}')
PARTITION BY toYYYYMM(_timestamp)
ORDER BY _timestamp
TTL toDateTime(_timestamp) + INTERVAL 90 DAY;
Additionally, we’ve defined a custom HTTP Log schema that contains standard HTTP access log fields that we use for storing logs from various proxies like NGINX/HAProxy used across different services.
CREATE TABLE IF NOT EXISTS http_local ON CLUSTER '{cluster}' (
	`_timestamp` Datetime64(3, 'Asia/Kolkata'),
	`_hostname` Nullable(String),
	`_source` Nullable(String),
	`version` UInt8,
	`type` LowCardinality(String),
	`client_ip` Nullable(String),
	`http_bytes_sent` UInt32,
	`http_method` LowCardinality(String),
	`http_referer` Nullable(String),
	`http_status` UInt16,
	`http_timestamp` Datetime64(3, 'Asia/Kolkata'),
	`http_body` Nullable(String),
	`http_uri` Nullable(String),
	`http_user_agent` Nullable(String),
	`http_version`  Nullable(String),
	`user_id` String
)
ENGINE = ReplicatedMergeTree('/clickhouse/tables/{cluster}/{shard}/{table}', '{replica}')
PARTITION BY toYYYYMM(http_timestamp)
ORDER BY (type,http_timestamp);
To optimize the storage of finite unique values in columns, we use the LowCardinality modifier, which encodes a column’s value and stores an integer representation of it. This technique is particularly useful in reducing memory or speeding up queries when filtering such columns which have <=10k unique values.
We also utilise TTLs extensively in ClickHouse to delete old data after a certain period of time. We have defined different retention periods for logs with levels debug and warn as follows:
ALTER TABLE logs.app_local ON CLUSTER '{cluster}' MODIFY TTL toDateTime(_timestamp) + INTERVAL 15 DAY DELETE WHERE lvl='debug', toDateTime(_timestamp) + INTERVAL 30 DAY DELETE WHERE lvl='warn';
Disk space and costs comparisons
We benchmarked the disk savings after migrating to ClickHouse and found a phenomenal 20x reduction in the size of the same set of logs.
| Stack | Disk Space | Rows | Avg Size (Bytes/Row) |
|---|---|---|---|
| Elasticsearch | 22.1GB | 65 million | 340 |
| Clickhouse | 1.13GB | 65 million | 17.38 |
After migrating from ELK to Clickhouse, we now have around 30 billion log lines across our Clickhouse clusters, which collectively only take up 2.5TB of disk space. In comparison, our previous ELK setup had 28 billion log lines, which required roughly 13TB of disk space. It’s important to note that these numbers are slightly different from our benchmark results since our benchmarks only compared the log size of a specific application in both stacks. In a real-world setup, where we have a vast number of heterogeneous logs, with some services generating more metadata than others, the size difference would vary. Nevertheless, we are thrilled to see a significant reduction in our EBS disk size.
To run our 4-node Clickhouse cluster, we’re utilizing a set of 4x r5a.2xlarge instances, which are overpowered for the given load with 8 cores and 64GB RAM. In contrast, to run an ELK cluster of 3 nodes using the Opendistro setup, we required 3 m5a.8xlarge instances, each with 32 cores and 128GB RAM. We’re also enjoying significant cost savings since the Clickhouse instance collectively costs only $1.14 per hour, whereas the ELK nodes cost us $2.67 per hour. This excludes the EBS volumes, as we have mounted only 1/5th of the EBS volume size to the Clickhouse nodes compared to the ELK nodes.
Vector
Vector is an ultra-fast log shipping agent that has a low resource overhead. Designed to collect logs from various sources, Vector can perform numerous transformations on the collected logs and send them to multiple sinks. At Zerodha, we use Vector to gather logs, parse them into JSON or logfmt formats, create the desired schema output, and finally send them to Clickhouse for storage.
We run Vector in two distinct modes: Agent and Aggregator.
Vector agent
Each Amazon Machine Image (AMI) is set up with a Vector agent and default configuration to ship logs to a central Vector aggregator. This agent does most of the heavy lifting work, including:
- Collecting logs from a file or stdout source
- Enriching logs with metadata about the hostname and AWS EC2 tags
- Parsing logs into JSON or logfmt format
- Shipping logs to a central Vector aggregator cluster
Vector aggregator
It stores incoming logs in a disk buffer before writing them to an upstream sink. Since we store logs in a different table for each service, we use a routing key specified by the Vector agent. According to the key, we use the route transformer in Vector to send logs to a specific Clickhouse table.
Vector uses a domain specific language called VRL to apply transformations on the logs, which is incredibly powerful. We use VRL to perform a bunch of transformations to the original log event. A few examples:
- Parsing raw logs into JSON or logfmt format
- Adding or modifying fields in the logs
- Filtering out unwanted logs
- Enriching logs with metadata
Here are some examples of VRL to demonstrate how to transform the source logs into the desired format:
- Ignore logs with certain keywords in them
if contains(string!(.message), "ELB-HealthChecker") {
    abort
}
- Ensure strict types for the parsed columns
# Status field must be an int.

http_status, err = to_int(parsed.http_status)
if err != null {
    http_status = 0
}
- A full example of parsing a JSON message and then creating a different schema output from it
source = '''
# This timestamp is used to record the log ingestion timestamp.
_timestamp = .timestamp
_hostname = .host

smtp_id = "primary"

# JSON parse the message field. In case it's not parse-able, log an error
# and drop the event.
msg, err = parse_json(.message)
if err !=null {
	log(.message, level: "error")
}

# Prepare the full event payload.
. = {
	"_timestamp": to_unix_timestamp!(_timestamp, unit: "milliseconds"),
	"_hostname": _hostname,
	"smtp_id": smtp_id,
	"recipient": downcase!(msg.recipient),
	"from_email": msg.from,
	"subject": msg.subject,
	"logged_at": to_unix_timestamp(parse_timestamp!(msg.time, format: "%+"),unit: "milliseconds"),
	"status": msg.type,
	"dest_ip": msg.smtp_ip,
	"smtp_response": msg.smtp_response,
}
'''
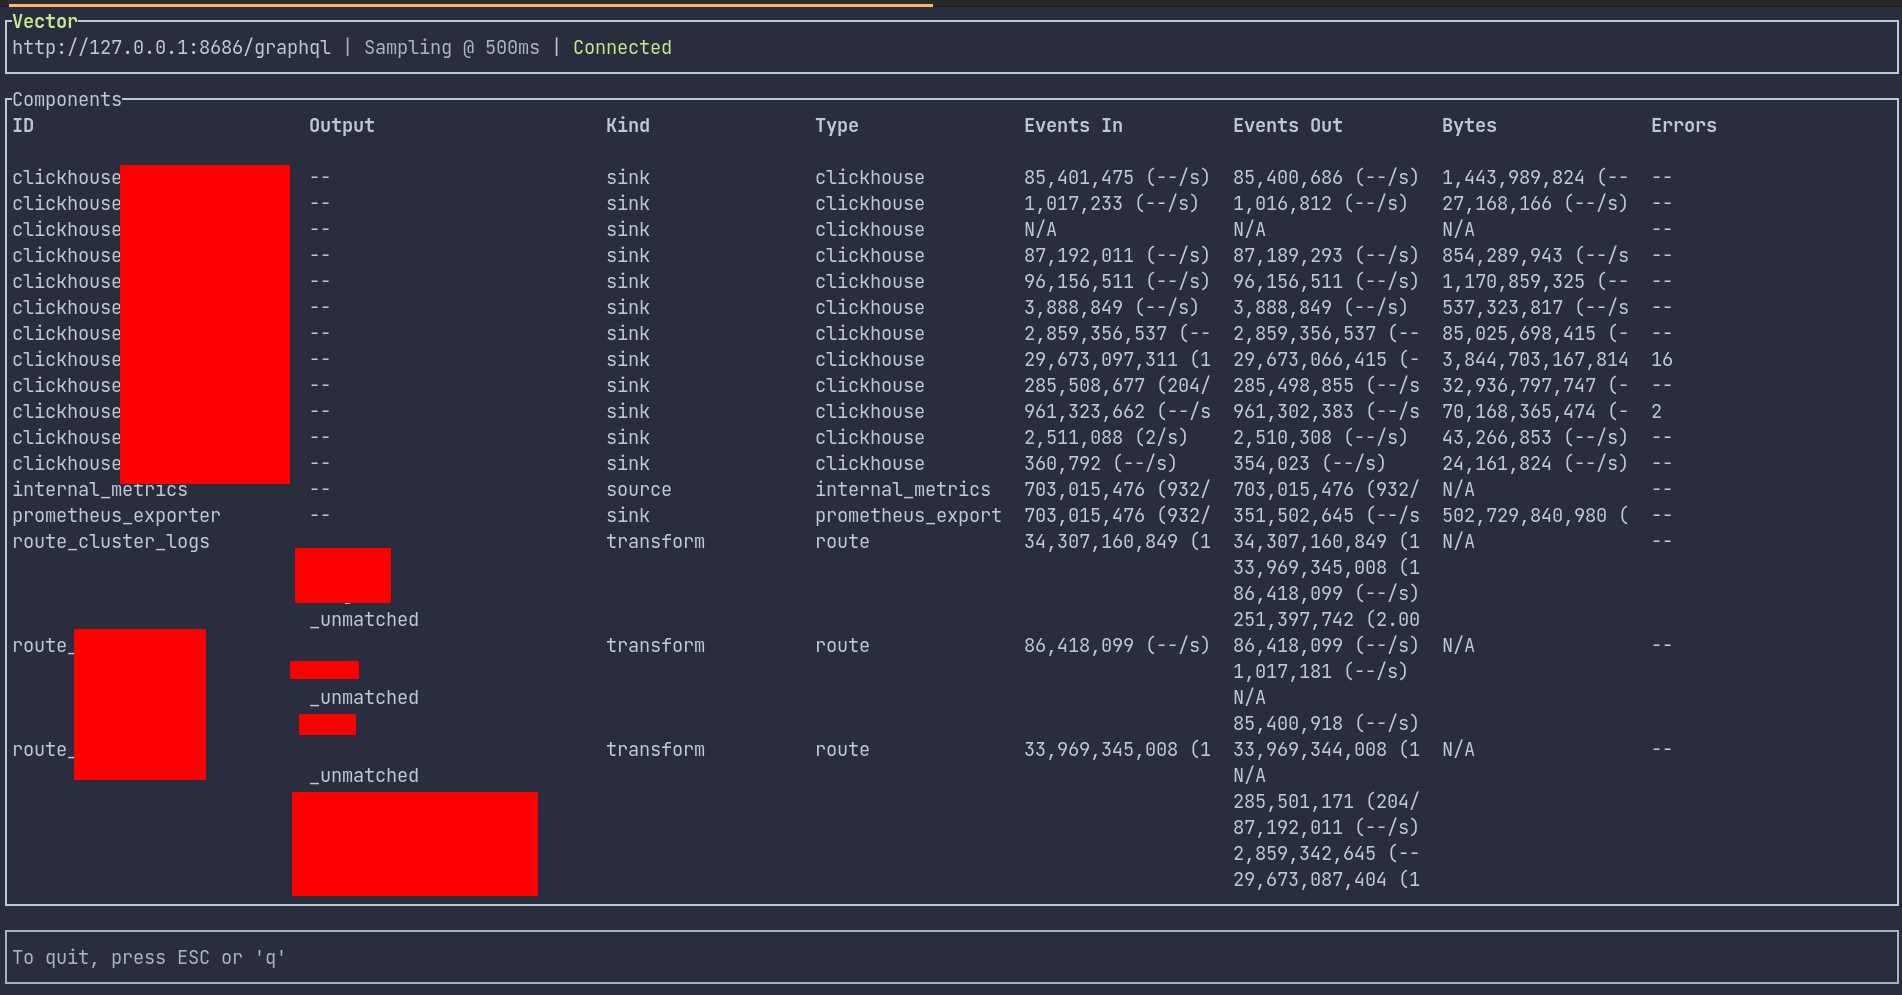
Vector also comes with a handy vector top command which quickly gives an overview of how many logs are sent and how many are in the buffer.
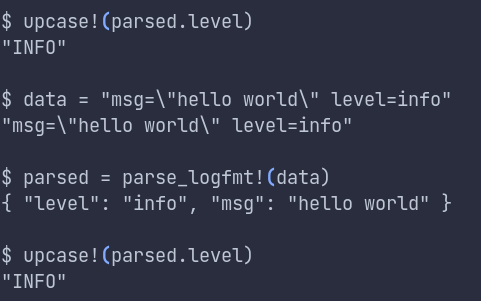
Vector bundles a useful interactive command line tool called vrl which can be used to test the VRL script. It has proven extremely useful while debugging or writing a completely new pipeline.
We have been pleased with Vector, which replaced both Filebeat and Logstash with just one tool. We highly recommend it to anyone building a log pipeline. Additionally, since Vector is written in Rust, it has a smaller resource footprint compared to a heavier Logstash server with huge JVM requirements.
Metabase
Metabase is a powerful query and visualization tool that we use with Clickhouse. While Metabase is well-known for its data visualization capabilities, its role-based access control (RBAC) system is a lesser-known feature that is critical for our team. Since we use the same Metabase instance across all our teams, we need a robust RBAC system to ensure that each team member can only access the data they are authorized to view. For example, a developer who owns App-A should only be able to access the logs for that service. To achieve this, we use a combination of Clickhouse users/groups ACLs and Metabase database permissions.
One of the useful features of Metabase is the ability to pre-format query templates. We’ve taken advantage of this feature by creating pre-formatted query templates for all the common queries that our non-technical teams need. In addition, our non-technical teams have picked up essential SQL skills and can customize these queries when necessary.
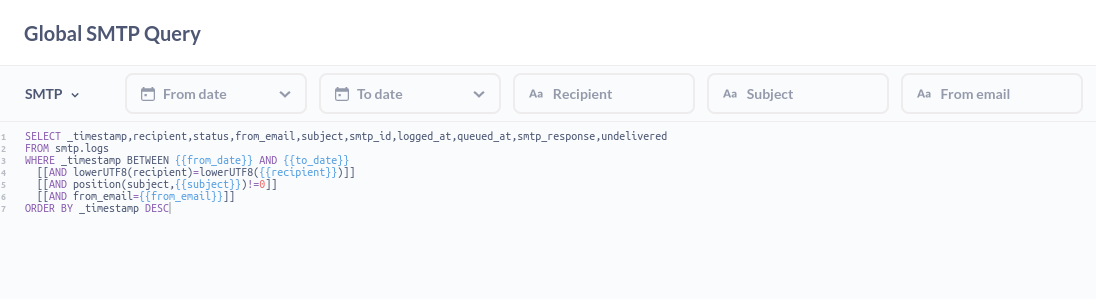
Here are some of the most frequently used queries that we rely on internally:
- Getting error logs
SELECT _timestamp,msg,err
FROM app
WHERE lvl = 'error'
ORDER BY _timestamp DESC
- Doing a partial match of a string
SELECT *
FROM app
WHERE(position(msg, 'timeout') != 0)
ORDER BY _timestamp DESC
- Filtering using a nested param
SELECT
    _timestamp, msg, lvl, sc
FROM app
WHERE visitParamExtractString(p, 'nomad_job')='hello'
ORDER BY _timestamp DESC
Challenges with Metabase for querying logs
There are several challenges with using Metabase for log searches and analytics, as it was not specifically designed for this purpose. One significant limitation is the absence of live tail functionality. Typically, a WebSocket or live polling connection would need to be established with the database server to enable the live tailing of logs.
Additionally, performing context-specific queries can be difficult. For example, when searching for a pattern such as “error connecting to db,” it is often necessary to find the logs surrounding this line to understand how the issue occurred. While SQL queries can identify lines that match the pattern, this process can be challenging, and we often have to resort to timestamp-based searches, making it a multi-step process.
Another significant issue is the lack of a user interface to slice and drill logs based on time periods. We have found this feature severely lacking in Metabase, and we are currently exploring alternate UI solutions.
While Metabase has served us well so far, there is certainly room for improvement, especially regarding a more tailored UI for Clickhouse. We recognize that this is an open problem, and we plan to continue exploring potential solutions.
Loj CLI
In addition to Metabase, we also experimented with an internal Golang based CLI tool which connected to Clickhouse using the HTTP interface and made querying the logs on terminal easier.
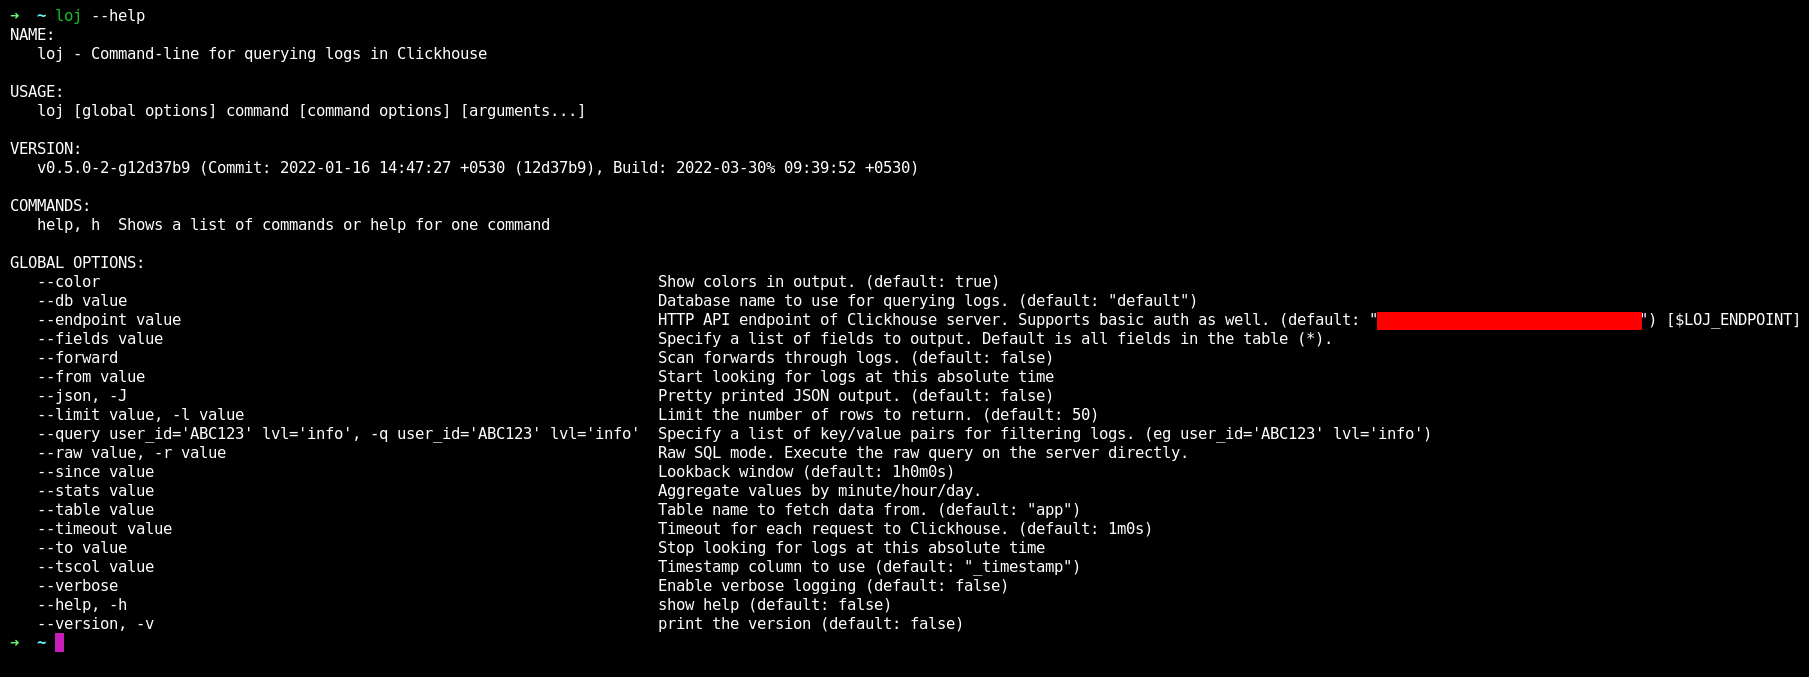
Using this Loj CLI, we were able to access the production Clickhouse cluster with proper access/authorization flow and query the logs on terminal with few command line params which formatted a SQL query. Some examples of the CLI:
- Query logs since 6h limited to last 1000 lines
loj --db=app --since="6h" --limit=1000
- Query logs with multiple filter conditions
loj --db=app --query="msg~'retry in 5 seconds';lvl~'warn'"
- Output the result with JSON and pipe it to jq:
loj --db=app -J | jq '.'
- Sort by unique values
loj --db=app --fields="msg" | sort | uniq -c
- Perform aggregate queries
loj --db=app --query="lvl='error'" --stats="minute" --since="15m" --limit=5
┏━━━━━━━┳━━━━━━━┓
┃ time  ┃ total ┃
┡━━━━━━━╇━━━━━━━┩
│ 23:04 │    80 │
├───────┼───────┤
│ 23:03 │   112 │
├───────┼───────┤
│ 23:02 │   101 │
├───────┼───────┤
│ 23:01 │   177 │
├───────┼───────┤
│ 23:00 │   102 │
└───────┴───────┘
Challenges with Clickhouse
There’s no system in production that hasn’t had any failures/seen downtimes, and Loj is no exception. While Clickhouse has been a much stabler stack compared to Elasticsearch, we encountered a few challenges and key decisions with tradeoffs that come with them that we think are equally important to talk about them as much as it’s essential to talk about its strong aspects.
Choosing the right partition key
Clickhouse organizes data into multiple partitions, each defined by a partition key. For applications with low log volume or a short time-to-live (TTL), partitioning data into monthly blocks is often sufficient. However, if query patterns focus on finding data within a few days rather than months, it’s better to split partitions into daily blocks.
It’s important to keep in mind that Clickhouse stores metadata about each partition block, including the partition key range and its location on disk. As the number of partitions increases, queries can become slower as Clickhouse needs to scan different locations on disk and merge the results. This can result in higher memory usage and slower query performance.
For applications that receive a high volume of logs, we have specified a daily partition since our query patterns typically involve finding results within a few days. However, for apps with lower log volume, we stick to monthly partitions since daily partitions would result in much smaller data chunks and increase the I/O time required to scan through all the partitions.
Too many INSERTs
Managing data ingestion throughput can be a tricky task with Clickhouse. As we have seen, data is stored in partitions and then divided into smaller blocks called “parts”. When new data is written to a table, Clickhouse creates parts that are ordered by the PRIMARY KEY columns. To execute a query, Clickhouse looks for the relevant partition, then distributes the query to each part in the partition and finally merges the results to produce a final output.
The number of entries in a block is set by the index_granularity parameter, which we usually configure to a fixed value of 8192 entries(default value) per block. Once this threshold is reached, Clickhouse creates a new part for the partition. The number of active parts per partition is not fixed, and Clickhouse periodically runs compaction and merge processes to reduce I/O operations and compress data on disk. However, there is a limit on the number of active parts that can be in a partition before new inserts start to fail.
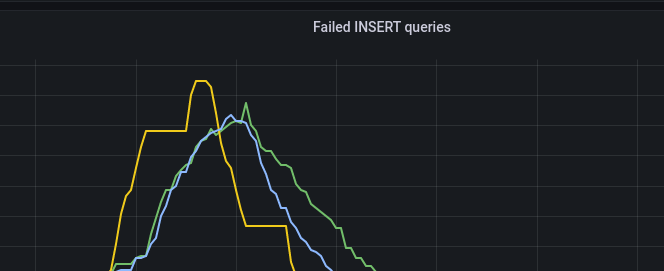
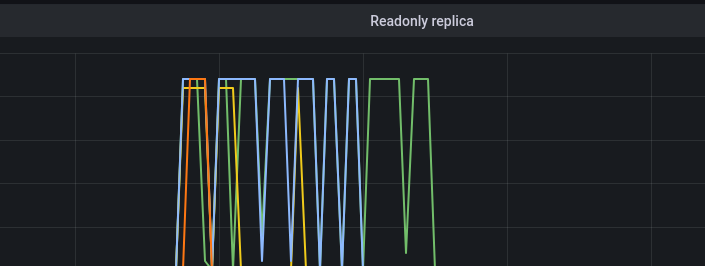
In our case, we hit this limit during peak load times, when log volumes increased, leading to a higher number of INSERT queries. Clickhouse reached the maximum number of active parts, and the merge process couldn’t keep up with the high throughput of INSERT operations. This caused the table to become “read-only”, and Clickhouse failed to insert any new data before merging the smaller active parts.
After several hours of debugging, we realized the insert queries failed because we weren’t batching our inserts to the server. In our v1 setup, we had vector agents directly hitting Clickhouse, which queued a huge number of INSERT queries bringing down our Clickhouse cluster. We solved this issue by setting up a cluster of vector aggregators to help with batching the data. Vector agents were configured to send data to these aggregators instead of directly sending small chunks to the Clickhouse server. This approach allowed us to control the inserts at the aggregator level, ensuring a predictable and durable insert strategy and overcome the challenge of too many INSERT queries.
Choosing an index
While ClickHouse fares excellently in almost all aspects of DB management, we found indexing to be a bit painful. ClickHouse uses a PRIMARY KEY, which plays a crucial role in query performance. As discussed earlier, the primary key columns determine the data ordering within the block. ClickHouse uses the concept of skip indices to skip data blocks where the query filter doesn’t match the primary key. This makes sequential data scans faster since less data is read.
In most cases, the primary key is sufficient for querying large datasets. However, indexing comes into play when different query patterns emerge over time, and we need to speed up common queries by adding indexing to other columns. It’s important to note that once you create a table, you cannot modify the Primary Key.
A few examples where we have added indexes:
- In our HTTP log schema, we added a Bloom Filter index on the
client_ipof the request since it’s one of the more commonly accessed columns in our queries. Bloom filters are memory efficient and are well suited for indexing columns with high cardinal values.
ALTER TABLE logs.http ON CLUSTER '{cluster}' ADD INDEX client_ip_idx client_ip TYPE bloom_filter GRANULARITY 1
- For partial-string matches, such as matching a URL param, we found the
tokenbf_v1index to be useful. It’s a specific form of Bloom filter that works well for string data types and use cases where fuzzy or partial string matches are required.
ALTER TABLE logs.http ON CLUSTER '{cluster}' ADD INDEX http_uri_idx http_uri TYPE tokenbf_v1(10240, 3, 0) GRANULARITY 4
Choosing sort keys
Besides indexing, and partition keys, another critical factor determining query performance is specifying the order of columns in the ORDER BY clause when creating the table.
ClickHouse has no strict recommendation for choosing the order of columns in the sort key. However, as a general rule, a binary search is performed if the SQL query contains at least one column that is part of the sort key. A Generic Exclusion Search Algorithm is used if the query only has one column that isn’t the first in the ORDER BY. The query will execute faster if the columns in the ORDER BY clause are ordered based on the ascending order of their cardinality.
Closing thoughts
We’ve been extremely pleased with our “future proof” Loj stack. It’s much easier to scale and operate than the previous ELK stack, and we can run ClickHouse on much smaller nodes and EBS volumes, resulting in significant cost and resource savings. Vector has been a great discovery and has simplified a chunk of our log shipping pipeline.